Mean State

Download Data
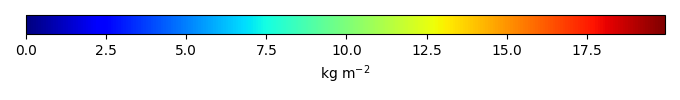
Period Mean (original grids) [Pg]
Model Period Mean (intersection) [Pg]
Benchmark Period Mean (intersection) [Pg]
Model Period Mean (complement) [Pg]
Benchmark Period Mean (complement) [Pg]
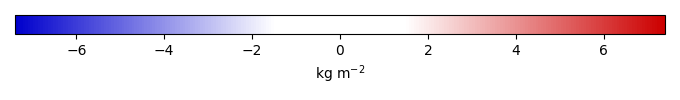
Bias [kg m-2]
Bias Score [1]
Spatial Distribution Score [1]
Overall Score [1]
Benchmark [-] 364.
E3SM [-] 993. 892. 363. 70.2 0.897 4.28 0.436 0.455 0.446
E3SM-FUN2.0 [-] 779. 699. 363. 54.9 0.897 2.72 0.511 0.575 0.543
E3SM-FUN3.0 [-] 536. 482. 363. 37.9 0.897 0.959 0.614 0.827 0.720

Temporally integrated period mean

BENCHMARK MEAN
Data not available
Data not available
MODEL MEAN
Data not available
Data not available
BIAS
Data not available
Data not available
BIAS SCORE
Data not available
Data not available

SPATIAL TAYLOR DIAGRAM
Data not available
MODEL COLORS
Data not available

Spatially integrated regional mean

MODEL COLORS
Data not available

Relationships

Download Data
Precipitation|GPCPv2.3 Hellinger Distance [1]
SurfaceDownwardSWRadiation|CERESed4.1 Hellinger Distance [1]
SurfaceAirTemperature|CRU4.02 Hellinger Distance [1]
Precipitation|GPCPv2.3 Score [1]
SurfaceDownwardSWRadiation|CERESed4.1 Score [1]
SurfaceAirTemperature|CRU4.02 Score [1]
Overall Score [1]
E3SM [-] 0.524 0.718 0.723 0.129 0.302 0.326 0.253
E3SM-FUN2.0 [-] 0.558 0.737 0.752 0.225 0.435 0.511 0.390
E3SM-FUN3.0 [-] 0.563 0.734 0.783 0.503 0.619 0.748 0.623

Precipitation/GPCPv2.3

Data not available
Data not available
Data not available

SurfaceDownwardSWRadiation/CERESed4.1

Data not available
Data not available
Data not available

SurfaceAirTemperature/CRU4.02

Data not available
Data not available
Data not available

All Models

Benchmark
Data not available
Data not available
E3SM
Data not available
Data not available
E3SM-FUN2.0
Data not available
Data not available
E3SM-FUN3.0
Data not available
Data not available

Data Information

  Title:
Global forest live biomass carbon version 5.1

  Version:
5.1

  Institutions:
Jet Propulsion Laboratory, California Institute of Technology, Pasadena, CA, USA

  Source:
A combination of data in situ inventory plots and satellite light detection and ranging (Lidar) samples

  History:
2017-10-31: downloaded source from https://science.jpl.nasa.gov/people/Saatchi
2019-03-14: convert original tif files to netcdf data using gdal_translate
2019-11-06: converted to ILAMB required netCDF with https://github.com/mmu2019/Datasets/blob/master/read-biomass-GlobalCarbon.py

  References:
Saatchi, S.S., N.L. Harris, S. Brown, M. Lefsky, E.T. Mitchard, W. Salas, B.R. Zutta, W. Buermann, S.L. Lewis, S. Hagen, S. Petrova, L. White, M. Silman, and A. Morel (2011), Benchmark map of forest carbon stocks in tropical regions across three continents, Proceedings of the National Academy of Sciences, 108(24), 9899-9904, doi:10.1073/pnas.1019576108

  Comments:
time_period: climatology
original_temporal_resolution: climatology
original_spatial_resolution: 0.25 degree
original_units: kg/m2 biomass
final_temporal_resolution: climatology
final_spatial_resolution: 0.5 degree
final_units: kg/m2 carbon

  Convention:
CF-1.7