Mean State
Download Data |
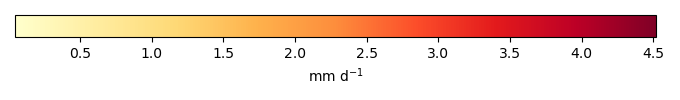
Period Mean (original grids) [mm d-1] |
Model Period Mean (intersection) [mm d-1] |
Benchmark Period Mean (intersection) [mm d-1] |
Model Period Mean (complement) [mm d-1] |
Benchmark Period Mean (complement) [mm d-1] |
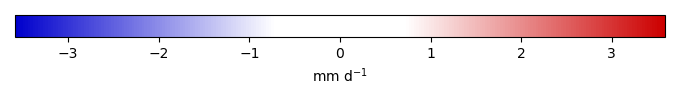
Bias [mm d-1] |
RMSE [mm d-1] |
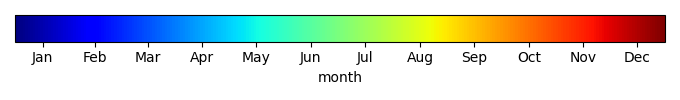
Phase Shift [months] |
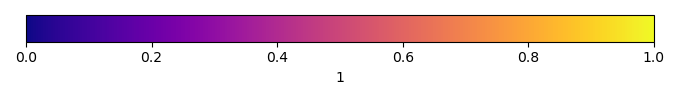
Bias Score [1] |
RMSE Score [1] |
Seasonal Cycle Score [1] |
Spatial Distribution Score [1] |
Overall Score [1] |
|||
|---|---|---|---|---|---|---|---|---|---|---|---|---|---|---|---|---|
| Benchmark | [-] | 2.16 | ||||||||||||||
| CABLE-POP | [-] | 2.17 | 2.17 | 2.03 | 2.87 | 0.145 | 0.573 | 0.732 | 0.813 | 0.781 | 0.899 | 0.972 | 0.849 | |||
| CARDAMOM | [-] | 2.34 | 2.34 | 2.18 | 2.12 | 0.162 | 0.641 | 0.740 | 0.808 | 0.763 | 0.897 | 0.975 | 0.841 | |||
| CLASSIC | [-] | 2.31 | 2.30 | 2.13 | 0.255 | 2.53 | 0.176 | 0.622 | 0.731 | 0.807 | 0.773 | 0.894 | 0.965 | 0.843 | ||
| CliMA-Land | [-] | 2.19 | 2.19 | 2.04 | 2.93 | 0.144 | 0.651 | 0.841 | 0.798 | 0.748 | 0.885 | 0.972 | 0.830 | |||
| CLM6.0 | [-] | 2.29 | 2.28 | 2.11 | 0.305 | 3.11 | 0.176 | 0.649 | 0.790 | 0.798 | 0.765 | 0.887 | 0.961 | 0.835 | ||
| DLEM | [-] | 2.26 | 2.26 | 2.09 | 2.94 | 0.175 | 0.640 | 0.793 | 0.802 | 0.763 | 0.889 | 0.961 | 0.836 | |||
| ED | [-] | 0.183 | 0.183 | 2.04 | 2.89 | -1.86 | 2.19 | 0.779 | 0.291 | 0.539 | 0.893 | 0.0344 | 0.459 | |||
| ELM | [-] | 2.29 | 2.28 | 2.11 | 0.300 | 3.04 | 0.171 | 0.665 | 0.815 | 0.796 | 0.760 | 0.884 | 0.958 | 0.831 | ||
| IBIS | [-] | 2.23 | 2.23 | 2.07 | 2.61 | 0.157 | 0.607 | 0.736 | 0.810 | 0.774 | 0.897 | 0.965 | 0.844 | |||
| iMAPLE | [-] | 2.19 | 2.19 | 2.04 | 2.90 | 0.152 | 0.578 | 0.731 | 0.812 | 0.780 | 0.901 | 0.970 | 0.849 | |||
| ISAM | [-] | 2.22 | 2.22 | 2.06 | 2.70 | 0.155 | 0.607 | 0.748 | 0.809 | 0.772 | 0.896 | 0.965 | 0.843 | |||
| ISBA-CTRIP | [-] | 2.16 | 2.16 | 2.14 | 0.0741 | 2.73 | 0.0197 | 0.754 | 0.768 | 0.770 | 0.723 | 0.887 | 0.944 | 0.809 | ||
| JSBACH | [-] | 2.17 | 2.16 | 2.02 | 2.96 | 0.143 | 0.559 | 0.716 | 0.817 | 0.786 | 0.903 | 0.975 | 0.853 | |||
| JULES | [-] | 2.26 | 2.26 | 2.09 | 2.94 | 0.171 | 0.630 | 0.776 | 0.803 | 0.768 | 0.891 | 0.962 | 0.838 | |||
| LPJml | [-] | 2.26 | 2.26 | 2.09 | 2.94 | 0.171 | 0.630 | 0.776 | 0.803 | 0.768 | 0.891 | 0.962 | 0.838 | |||
| LPJwsl | [-] | 2.19 | 2.19 | 2.05 | 2.89 | 0.145 | 0.604 | 0.749 | 0.808 | 0.773 | 0.895 | 0.964 | 0.843 | |||
| LPX | [-] | 2.26 | 2.26 | 2.10 | 2.70 | 0.159 | 0.629 | 0.743 | 0.806 | 0.769 | 0.892 | 0.961 | 0.839 | |||
| OCN | [-] | 2.22 | 2.22 | 2.06 | 0.308 | 2.95 | 0.167 | 0.610 | 0.770 | 0.807 | 0.772 | 0.889 | 0.965 | 0.841 | ||
| ORCHIDEE | [-] | 2.26 | 2.26 | 2.09 | 2.94 | 0.171 | 0.630 | 0.776 | 0.803 | 0.768 | 0.891 | 0.962 | 0.838 | |||
| SDGVM | [-] | 2.30 | 2.30 | 2.10 | 0.306 | 2.68 | 0.204 | 0.637 | 0.743 | 0.801 | 0.766 | 0.894 | 0.960 | 0.838 | ||
| VISIT | [-] | 2.20 | 2.20 | 2.06 | 2.71 | 0.141 | 0.598 | 0.719 | 0.811 | 0.774 | 0.898 | 0.966 | 0.845 | |||
| VISIT-UT | [-] | 2.20 | 2.20 | 2.06 | 2.71 | 0.140 | 0.598 | 0.719 | 0.811 | 0.774 | 0.898 | 0.966 | 0.845 |
Temporally integrated period mean