Mean State

Download Data
Period Mean (original grids) [Pg yr-1]
Model Period Mean (intersection) [Pg yr-1]
Benchmark Period Mean (intersection) [Pg yr-1]
Model Period Mean (complement) [Pg yr-1]
Benchmark Period Mean (complement) [Pg yr-1]
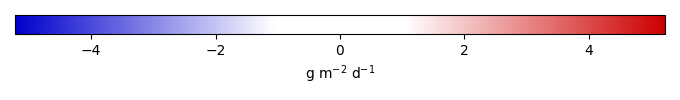
Bias [g m-2 d-1]
RMSE [g m-2 d-1]
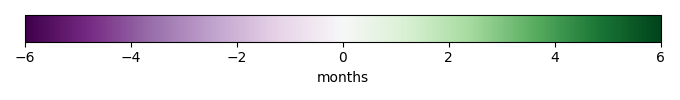
Phase Shift [months]
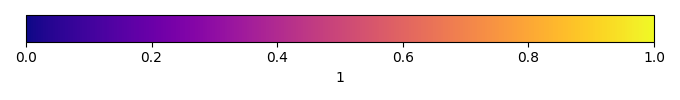
Bias Score [1]
RMSE Score [1]
Seasonal Cycle Score [1]
Spatial Distribution Score [1]
Overall Score [1]
Benchmark [-] 95.7
CABLE-POP [-] 114. 112. 90.7 2.34 5.01 0.502 1.10 0.942 0.390 0.582 0.818 0.913 0.657
CLASSIC [-] 145. 129. 95.4 14.9 0.273 0.786 1.24 0.959 0.322 0.562 0.803 0.810 0.612
CliMA-Land [-] -1.68e+06 -1.67e+06 0.896 -1.17e+04 95.6 -1.10e+06 5.75e+07 0.746 0.123 0.388 0.891 7.96e-16
CLM6.0 [-] 162. 141. 95.2 18.5 0.505 1.07 1.86 0.996 0.259 0.470 0.821 0.792 0.562
DLEM [-] 130. 129. 95.7 0.288 0.00206 0.776 1.47 1.12 0.304 0.547 0.779 0.668 0.569
ED [-] 102. 102. 95.6 0.0923 0.109 0.140 1.56 1.49 0.301 0.380 0.756 0.749 0.513
ELM [-] 185. 162. 95.1 20.8 0.530 1.54 1.91 0.741 0.227 0.596 0.862 0.639 0.584
IBIS [-] 111. 110. 95.4 0.606 0.311 0.343 1.32 1.09 0.327 0.465 0.781 0.853 0.578
iMAPLE [-] 141. 137. 95.7 4.26 0.952 1.60 0.935 0.286 0.517 0.827 0.748 0.579
ISAM [-] 109. 109. 95.6 0.0919 0.0379 0.298 1.04 0.970 0.386 0.553 0.837 0.877 0.641
ISBA-CTRIP [-] 141. 121. 95.7 20.1 0.577 1.21 1.18 0.364 0.492 0.764 0.768 0.576
JSBACH [-] 130. 122. 87.7 7.42 7.95 0.827 1.47 1.09 0.322 0.466 0.818 0.738 0.562
JULES [-] 134. 131. 93.2 2.88 2.42 0.886 1.59 0.841 0.270 0.418 0.846 0.710 0.532
LPJml [-] 162. 151. 95.7 11.1 1.27 1.66 1.02 0.298 0.458 0.801 0.891 0.581
LPJwsl [-] 134. 134. 95.7 0.303 0.872 1.53 0.881 0.370 0.458 0.845 0.950 0.616
LPX [-] 124. 122. 95.7 1.88 0.00836 0.604 1.21 0.994 0.390 0.440 0.846 0.942 0.612
OCN [-] 142. 138. 93.7 4.05 1.96 1.04 1.42 0.857 0.267 0.514 0.837 0.861 0.599
ORCHIDEE [-] 110. 108. 95.7 1.25 0.294 1.00 0.894 0.410 0.563 0.827 0.861 0.645
SDGVM [-] 93.3 88.5 95.0 4.73 0.681 -0.149 0.907 1.45 0.494 0.485 0.784 0.953 0.640
VISIT [-] 117. 115. 93.8 1.12 1.89 0.506 1.27 0.866 0.363 0.537 0.823 0.873 0.627
VISIT-UT [-] 118. 117. 93.8 1.15 1.89 0.537 1.35 0.846 0.342 0.517 0.816 0.856 0.609

Temporally integrated period mean

BENCHMARK MEAN
Data not available
Data not available
MODEL MEAN
Data not available
Data not available
BIAS
Data not available
Data not available
BIAS SCORE
Data not available
Data not available
RMSE
Data not available
Data not available
RMSE SCORE
Data not available
Data not available
BENCHMARK MAX MONTH
Data not available
Data not available
MODEL MAX MONTH
Data not available
Data not available
DIFFERENCE IN MAX MONTH
Data not available
Data not available
SEASONAL CYCLE SCORE
Data not available
Data not available

SPATIAL TAYLOR DIAGRAM
Data not available
MODEL COLORS
Data not available

Spatially integrated regional mean

MODEL COLORS
Data not available
REGIONAL MEAN
Data not available
ANNUAL CYCLE
Data not available
MONTHLY ANOMALY
Data not available
ANNUAL CYCLE
Data not available

Relationships

Download Data
Evapotranspiration|GLEAMv3.3a Hellinger Distance [1]
Precipitation|GPCPv2.3 Hellinger Distance [1]
SurfaceAirTemperature|CRU4.02 Hellinger Distance [1]
SurfaceDownwardSWRadiation|CERESed4.2 Hellinger Distance [1]
Evapotranspiration|GLEAMv3.3a Score [1]
Precipitation|GPCPv2.3 Score [1]
SurfaceAirTemperature|CRU4.02 Score [1]
SurfaceDownwardSWRadiation|CERESed4.2 Score [1]
Overall Score [1]
CABLE-POP [-] 0.491 0.522 0.608 0.592 0.736 0.745 0.826 0.798 0.776
CLASSIC [-] 0.549 0.549 0.658 0.602 0.640 0.774 0.672
CliMA-Land [-] 0.387
CLM6.0 [-] 0.514 0.493 0.627 0.571 0.507 0.577 0.598 0.621 0.576
DLEM [-] 0.598 0.590 0.677 0.615 0.566 0.728 0.636
ED [-] 0.411 0.381 0.498 0.487 0.624 0.000127 0.858 0.794 0.569
ELM [-] 0.484 0.486 0.612 0.611 0.374 0.434 0.572 0.567 0.486
IBIS [-] 0.608 0.612 0.683 0.662 0.609 0.721 0.794 0.797 0.730
iMAPLE [-] 0.561 0.524 0.663 0.661 0.584 0.562 0.850 0.742 0.684
ISAM [-] 0.578 0.609 0.677 0.717 0.773 0.880 0.790
ISBA-CTRIP [-] 0.548 0.665 0.572 0.771 0.672
JSBACH [-] 0.685 0.593 0.681 0.657 0.724 0.507 0.786 0.750 0.692
JULES [-] 0.508 0.508 0.621 0.601 0.452 0.500 0.771 0.727 0.612
LPJml [-] 0.408 0.452 0.680 0.604 0.646 0.620 0.623
LPJwsl [-] 0.364 0.409 0.578 0.413 0.750 0.672 0.612
LPX [-] 0.353 0.499 0.666 0.515 0.518 0.810 0.838 0.414 0.645
OCN [-] 0.493 0.459 0.617 0.587 0.626 0.686 0.727 0.603 0.661
ORCHIDEE [-] 0.607 0.626 0.669 0.661 0.673 0.835 0.867 0.841 0.804
SDGVM [-] 0.657 0.673 0.732 1.00 0.911 0.813 0.790
VISIT [-] 0.542 0.569 0.649 0.648 0.718 0.759 0.854 0.490 0.705
VISIT-UT [-] 0.552 0.560 1.00 0.716 0.744

Evapotranspiration/GLEAMv3.3a

Data not available
Data not available
Data not available

Precipitation/GPCPv2.3

Data not available
Data not available
Data not available

SurfaceDownwardSWRadiation/CERESed4.2

Data not available
Data not available
Data not available

SurfaceAirTemperature/CRU4.02

Data not available
Data not available
Data not available

All Models

Benchmark
Data not available
Data not available
CABLE-POP
Data not available
Data not available
CLASSIC
Data not available
Data not available
CliMA-Land
Data not available
Data not available
CLM6.0
Data not available
Data not available
DLEM
Data not available
Data not available
ED
Data not available
Data not available
ELM
Data not available
Data not available
IBIS
Data not available
Data not available
iMAPLE
Data not available
Data not available
ISAM
Data not available
Data not available
ISBA-CTRIP
Data not available
Data not available
JSBACH
Data not available
Data not available
JULES
Data not available
Data not available
LPJml
Data not available
Data not available
LPJwsl
Data not available
Data not available
LPX
Data not available
Data not available
OCN
Data not available
Data not available
ORCHIDEE
Data not available
Data not available
SDGVM
Data not available
Data not available
VISIT
Data not available
Data not available
VISIT-UT
Data not available
Data not available

Data Information

  Title:
FLUXCOM (RS+METEO) Global Land Carbon Fluxes using CRUNCEP climate data

  Version:
1

  Institutions:
Department Biogeochemical Integration, Max Planck Institute for Biogeochemistry, Germany

  Source:
Data generated by Artificial Neural Networks and forced with CRUNCEPv6 meteorological data and MODIS (RS+METEO) ftp://ftp.bgc-jena.mpg.de/pub/outgoing/FluxCom/CarbonFluxes_v1_2017/RS+METEO/CRUNCEPv6/raw/monthly/ ftp://ftp.bgc-jena.mpg.de/pub/outgoing/FluxCom/EnergyFluxes/RS_METEO/member/CRUNCEP_v8/monthly/

  History:
Fri Sep 26 13:06:25 2025: ncatted -a missing_value,lat,d,c, reco.nc Fri Sep 26 13:06:18 2025: ncatted -a missing_value,lon,d,c, reco.nc 2024-01-18: downloaded ['TER.ANN.CRUNCEPv6.monthly.1980.nc', 'TER.ANN.CRUNCEPv6.monthly.1981.nc', 'TER.ANN.CRUNCEPv6.monthly.1982.nc', 'TER.ANN.CRUNCEPv6.monthly.1983.nc', 'TER.ANN.CRUNCEPv6.monthly.1984.nc', 'TER.ANN.CRUNCEPv6.monthly.1985.nc', 'TER.ANN.CRUNCEPv6.monthly.1986.nc', 'TER.ANN.CRUNCEPv6.monthly.1987.nc', 'TER.ANN.CRUNCEPv6.monthly.1988.nc', 'TER.ANN.CRUNCEPv6.monthly.1989.nc', 'TER.ANN.CRUNCEPv6.monthly.1990.nc', 'TER.ANN.CRUNCEPv6.monthly.1991.nc', 'TER.ANN.CRUNCEPv6.monthly.1992.nc', 'TER.ANN.CRUNCEPv6.monthly.1993.nc', 'TER.ANN.CRUNCEPv6.monthly.1994.nc', 'TER.ANN.CRUNCEPv6.monthly.1995.nc', 'TER.ANN.CRUNCEPv6.monthly.1996.nc', 'TER.ANN.CRUNCEPv6.monthly.1997.nc', 'TER.ANN.CRUNCEPv6.monthly.1998.nc', 'TER.ANN.CRUNCEPv6.monthly.1999.nc', 'TER.ANN.CRUNCEPv6.monthly.2000.nc', 'TER.ANN.CRUNCEPv6.monthly.2001.nc', 'TER.ANN.CRUNCEPv6.monthly.2002.nc', 'TER.ANN.CRUNCEPv6.monthly.2003.nc', 'TER.ANN.CRUNCEPv6.monthly.2004.nc', 'TER.ANN.CRUNCEPv6.monthly.2005.nc', 'TER.ANN.CRUNCEPv6.monthly.2006.nc', 'TER.ANN.CRUNCEPv6.monthly.2007.nc', 'TER.ANN.CRUNCEPv6.monthly.2008.nc', 'TER.ANN.CRUNCEPv6.monthly.2009.nc', 'TER.ANN.CRUNCEPv6.monthly.2010.nc', 'TER.ANN.CRUNCEPv6.monthly.2011.nc', 'TER.ANN.CRUNCEPv6.monthly.2012.nc', 'TER.ANN.CRUNCEPv6.monthly.2013.nc']
2024-04-09: converted to netCDF, additionally we apply a mask where |var|<1e-15 for all time.

  References:
Jung, M., S. Koirala, U. Weber, K. Ichii, F. Gans, Gustau-Camps-Valls, D. Papale, C. Schwalm, G. Tramontana, and M. Reichstein (2019), The FLUXCOM ensemble of global land-atmosphere energy fluxes, Scientific Data, 74, doi:10.1038/s41597-019-0076-8

Tramontana, G., M. Jung, C.R. Schwalm, K. Ichii, G. Camps-Valls, B. Raduly, M. Reichstein, M.A. Arain, A. Cescatti, G. Kiely, L. Merbold, P. Serrano-Ortiz, S. Sickert, S. Wolf, and D. Papale (2016), Predicting carbon dioxide and energy fluxes across global FLUXNET sites with regression algorithms, Biogeosciences, 13, 4291-4313, doi:10.5194/bg-13-4291-2016

  Coordinates:
lat_bnds lon_bnds

  Nco:
netCDF Operators version 5.3.3 (Homepage = http://nco.sf.net, Code = http://github.com/nco/nco, Citation = 10.1016/j.envsoft.2008.03.004)