Mean State
Download Data |
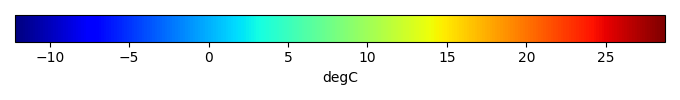
Period Mean (original grids) [degC] |
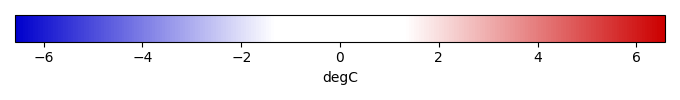
Bias [degC] |
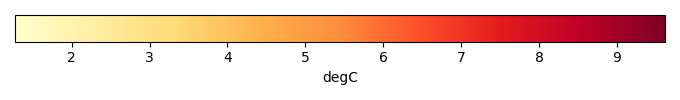
RMSE [degC] |
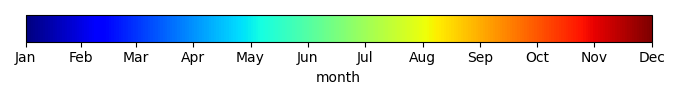
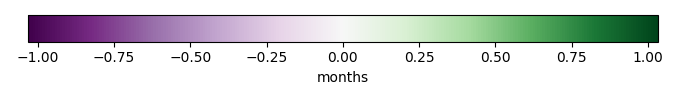
Phase Shift [months] |
Bias Score [1] |
RMSE Score [1] |
Seasonal Cycle Score [1] |
Overall Score [1] |
|||
|---|---|---|---|---|---|---|---|---|---|---|---|
| Benchmark | [-] | -1.76 | |||||||||
| ACCESS-ESM1-5 | [-] | -0.184 | 1.57 | 4.46 | 0.00 | 0.865 | 0.754 | 1.00 | 0.844 | ||
| ACCESS1-3 | [-] | -1.11 | 0.943 | 4.41 | 0.00 | 0.897 | 0.740 | 1.00 | 0.844 | ||
| CanESM2 | [-] | 0.358 | 2.52 | 5.62 | 0.00 | 0.818 | 0.705 | 1.00 | 0.807 | ||
| CanESM5 | [-] | -2.19 | -0.433 | 4.72 | 0.00 | 0.917 | 0.710 | 1.00 | 0.834 | ||
| CESM2 | [-] | -0.464 | 1.29 | 4.71 | 0.0646 | 0.885 | 0.728 | 0.996 | 0.834 | ||
| CNRM-ESM2-1 | [-] | 0.0389 | 1.79 | 4.60 | 0.00 | 0.866 | 0.739 | 1.00 | 0.836 | ||
| EnsembleCMIP5 | [-] | -0.381 | 1.68 | 4.08 | 0.00 | 0.873 | 0.774 | 1.00 | 0.855 | ||
| EnsembleCMIP6 | [-] | -0.816 | 0.940 | 3.59 | 0.00 | 0.905 | 0.781 | 1.00 | 0.867 | ||
| GFDL_ESM4 | [-] | -1.70 | 0.0527 | 4.12 | 0.00 | 0.946 | 0.740 | 1.00 | 0.856 | ||
| HadGEM2-CC | [-] | -5.26 | -3.50 | 6.51 | 0.00 | 0.774 | 0.655 | 1.00 | 0.771 | ||
| IPSL-CM5A-LR | [-] | -1.61 | 0.204 | 4.72 | 0.00 | 0.920 | 0.718 | 1.00 | 0.839 | ||
| IPSL-CM6A-LR | [-] | -1.88 | -0.124 | 5.43 | 0.00 | 0.941 | 0.670 | 1.00 | 0.820 | ||
| MIROC-ES2L | [-] | 0.274 | 2.03 | 4.96 | 0.00 | 0.834 | 0.741 | 1.00 | 0.829 | ||
| MPI-ESM1-2-LR | [-] | -0.612 | 1.14 | 4.94 | 0.191 | 0.893 | 0.707 | 0.987 | 0.823 | ||
| NorESM1-M | [-] | -2.78 | -0.669 | 5.12 | 0.00 | 0.933 | 0.687 | 1.00 | 0.827 | ||
| NorESM2-LM | [-] | -0.689 | 1.07 | 4.69 | 0.127 | 0.899 | 0.719 | 0.992 | 0.832 | ||
| UKESM1-0-LL | [-] | -3.73 | -1.98 | 5.28 | 0.00 | 0.868 | 0.692 | 1.00 | 0.813 |
Download Data |
Period Mean (original grids) [degC] |
Bias [degC] |
RMSE [degC] |
Phase Shift [months] |
Bias Score [1] |
RMSE Score [1] |
Seasonal Cycle Score [1] |
Overall Score [1] |
|||
|---|---|---|---|---|---|---|---|---|---|---|---|
| Benchmark | [-] | 10.3 | |||||||||
| ACCESS-ESM1-5 | [-] | 12.0 | 1.64 | 3.88 | 0.375 | 0.713 | 0.666 | 0.973 | 0.755 | ||
| ACCESS1-3 | [-] | 11.5 | 1.66 | 4.05 | 0.374 | 0.741 | 0.682 | 0.969 | 0.768 | ||
| CanESM2 | [-] | 12.1 | 2.52 | 4.73 | 0.366 | 0.696 | 0.655 | 0.971 | 0.744 | ||
| CanESM5 | [-] | 11.0 | 0.733 | 3.90 | 0.470 | 0.749 | 0.644 | 0.962 | 0.750 | ||
| CESM2 | [-] | 12.0 | 1.69 | 3.75 | 0.591 | 0.727 | 0.671 | 0.959 | 0.757 | ||
| CNRM-ESM2-1 | [-] | 10.5 | 0.227 | 3.44 | 0.470 | 0.761 | 0.674 | 0.966 | 0.769 | ||
| EnsembleCMIP5 | [-] | 10.9 | 1.19 | 3.27 | 0.320 | 0.781 | 0.741 | 0.977 | 0.810 | ||
| EnsembleCMIP6 | [-] | 11.1 | 0.772 | 2.97 | 0.350 | 0.778 | 0.727 | 0.976 | 0.802 | ||
| GFDL_ESM4 | [-] | 9.56 | -0.749 | 3.35 | 0.325 | 0.780 | 0.658 | 0.972 | 0.767 | ||
| HadGEM2-CC | [-] | 9.49 | -0.956 | 4.17 | 0.559 | 0.793 | 0.635 | 0.954 | 0.754 | ||
| IPSL-CM5A-LR | [-] | 9.02 | -0.877 | 3.68 | 0.415 | 0.788 | 0.679 | 0.966 | 0.778 | ||
| IPSL-CM6A-LR | [-] | 9.96 | -0.346 | 3.78 | 0.506 | 0.778 | 0.651 | 0.962 | 0.761 | ||
| MIROC-ES2L | [-] | 12.2 | 1.88 | 4.03 | 0.323 | 0.725 | 0.656 | 0.969 | 0.752 | ||
| MPI-ESM1-2-LR | [-] | 10.6 | 0.282 | 3.61 | 0.415 | 0.773 | 0.648 | 0.966 | 0.759 | ||
| NorESM1-M | [-] | 10.0 | -0.00451 | 3.67 | 0.416 | 0.803 | 0.680 | 0.967 | 0.782 | ||
| NorESM2-LM | [-] | 12.0 | 1.67 | 3.87 | 0.631 | 0.732 | 0.659 | 0.957 | 0.752 | ||
| UKESM1-0-LL | [-] | 9.62 | -0.688 | 3.99 | 0.475 | 0.759 | 0.629 | 0.958 | 0.744 |
Temporally integrated period mean