Mean State

Download Data
Period Mean (original grids) [Pg]
Model Period Mean (intersection) [Pg]
Benchmark Period Mean (intersection) [Pg]
Model Period Mean (complement) [Pg]
Benchmark Period Mean (complement) [Pg]
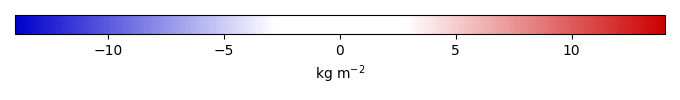
Bias [kg m-2]
Bias Score [1]
Spatial Distribution Score [1]
Overall Score [1]
Benchmark [-] 26.2
ACCESS-ESM1-5 [-] 684. 36.6 26.1 672. 0.0288 1.28 0.628 0.879 0.754
BCC-CSM2-MR [-] 393. 21.1 26.0 401. 0.137 -0.613 0.632 0.792 0.712
CanESM2 [-] 534. 18.5 26.2 517. -0.924 0.588 0.829 0.708
CanESM5 [-] 640. 36.9 26.2 710. 1.29 0.600 0.877 0.738
CESM2 [-] 579. 13.2 26.1 565. 0.0878 -1.58 0.548 0.705 0.626
CNRM-ESM2-1 [-] 728. 48.9 26.2 679. 0.00130 2.76 0.554 0.706 0.630
EnsembleCMIP5 [-] 694. 24.1 26.2 670. -0.276 0.653 0.640 0.646
EnsembleCMIP6 [-] 664. 25.4 26.2 639. -0.115 0.656 0.711 0.683
GFDL-ESM2M [-] 897. 27.2 26.2 963. 0.147 0.540 0.697 0.618
GFDL_ESM4 [-] 265. 12.6 26.2 460. -1.66 0.532 0.406 0.469
IPSL-CM5A-LR [-] 696. 43.7 26.2 860. 0.0252 2.13 0.532 0.792 0.662
IPSL-CM6A-LR [-] 445. 17.9 26.0 427. 0.171 -1.01 0.586 0.456 0.521
MIROC-ES2L [-] 479. 37.1 26.2 710. 0.000288 1.33 0.558 0.850 0.704
MPI-ESM-LR [-] 335. 10.6 25.3 325. 0.855 -1.87 0.518 0.225 0.371
MPI-ESM1-2-LR [-] 370. 10.9 25.3 359. 0.855 -1.81 0.471 0.277 0.374
NorESM1-M [-] 718. 25.9 26.2 692. -0.0416 0.634 0.822 0.728
NorESM2-LM [-] 612. 14.2 26.2 661. -1.44 0.550 0.726 0.638
UKESM1-0-LL [-] 711. 27.0 26.0 684. 0.162 0.100 0.597 0.801 0.699

Temporally integrated period mean

BENCHMARK MEAN
Data not available
Data not available
MODEL MEAN
Data not available
Data not available
BIAS
Data not available
Data not available
BIAS SCORE
Data not available
Data not available

SPATIAL TAYLOR DIAGRAM
Data not available
MODEL COLORS
Data not available

Spatially integrated regional mean

MODEL COLORS
Data not available

Relationships

Download Data
Precipitation|GPCPv2.3 Hellinger Distance [1]
SurfaceDownwardSWRadiation|CERESed4.1 Hellinger Distance [1]
SurfaceAirTemperature|CRU4.02 Hellinger Distance [1]
Precipitation|GPCPv2.3 Score [1]
SurfaceDownwardSWRadiation|CERESed4.1 Score [1]
SurfaceAirTemperature|CRU4.02 Score [1]
Overall Score [1]
ACCESS-ESM1-5 [-] 0.649 0.569 0.586 0.792 0.357 0.544 0.564
BCC-CSM2-MR [-] 0.631 0.574 0.686 0.451 0.569
CanESM2 [-] 0.576 0.572 0.573 0.484 0.485 0.514 0.494
CanESM5 [-] 0.662 0.602 0.547 0.512 0.480 0.545 0.512
CESM2 [-] 0.565 0.585 0.416 0.649 0.532
CNRM-ESM2-1 [-] 0.688 0.569 0.613 0.794 0.347 0.478 0.540
EnsembleCMIP5 [-] 0.643 0.598 0.564 0.478 0.461 0.495 0.478
EnsembleCMIP6 [-] 0.625 0.606 0.573 0.513 0.464 0.501 0.493
GFDL-ESM2M [-] 0.00
GFDL_ESM4 [-] 0.558 0.564 0.521 0.461 0.424 0.462 0.449
IPSL-CM5A-LR [-] 0.610 0.617 0.592 0.541 0.289 0.408 0.413
IPSL-CM6A-LR [-] 0.828 0.633 0.627 0.814 0.437 0.491 0.581
MIROC-ES2L [-] 0.649 0.572 0.610 0.836 0.372 0.519 0.576
MPI-ESM-LR [-] 0.00
MPI-ESM1-2-LR [-] 0.553 0.550 0.590 0.798 0.387 0.501 0.562
NorESM1-M [-] 0.586 0.609 0.529 0.473 0.508 0.468 0.483
NorESM2-LM [-] 0.573 0.565 0.536 0.515 0.451 0.497 0.488
UKESM1-0-LL [-] 0.580 0.562 0.583 0.717 0.269 0.464 0.483

Precipitation/GPCPv2.3

Data not available
Data not available
Data not available

SurfaceDownwardSWRadiation/CERESed4.1

Data not available
Data not available
Data not available

SurfaceAirTemperature/CRU4.02

Data not available
Data not available
Data not available

All Models

Benchmark
Data not available
Data not available
ACCESS-ESM1-5
Data not available
Data not available
BCC-CSM2-MR
Data not available
Data not available
CanESM2
Data not available
Data not available
CanESM5
Data not available
Data not available
CESM2
Data not available
Data not available
CNRM-ESM2-1
Data not available
Data not available
EnsembleCMIP5
Data not available
Data not available
EnsembleCMIP6
Data not available
Data not available
GFDL-ESM2M
Data not available
Data not available
GFDL_ESM4
Data not available
Data not available
IPSL-CM5A-LR
Data not available
Data not available
IPSL-CM6A-LR
Data not available
Data not available
MIROC-ES2L
Data not available
Data not available
MPI-ESM-LR
Data not available
Data not available
MPI-ESM1-2-LR
Data not available
Data not available
NorESM1-M
Data not available
Data not available
NorESM2-LM
Data not available
Data not available
UKESM1-0-LL
Data not available
Data not available

Data Information

  Approach:
To convert the original data at 250m to the final one at 0.5x0.5 degree resolution, Please see conversion steps listed in http://redwood.ess.uci.edu/mingquan/www/ILAMB/Download/CODES/CODES/subroutines/convert/readme_biomass. 3 codes below will be used in these steps. Code 1: http://redwood.ess.uci.edu/mingquan/www/ILAMB/Download/CODES/CODES/subroutines/convert/read-NBCD2000.pro Code 2: http://redwood.ess.uci.edu/mingquan/www/ILAMB/Download/CODES/CODES/subroutines/convert/convert-NBCD2000.ncl Code 3: http://redwood.ess.uci.edu/mingquan/www/ILAMB/Download/CODES/CODES/subroutines/convert/write-NBCD2000.ncl First, I used Code 1 to read data at 250m from the original geotiff file
then I used Code 2 to convert unit from the orignal unit of ton C per hectare to the final one of Kg C per m2, meanwhile I summed all available data points at 250m in each 0.5x0.5 grid cell to obtain the data at 0.5x0.5 degree resolution
finally I used Code 3 to create the final file in netCDF format.

  Temporal resolution:
yearly

  General information:
This product was derived from National Biomass and Carbon Dataset for the year 2000 originally in a raster format at 250m.

  Spatial resolution:
0.5x0.5 degree

  Derived data code:
http://redwood.ess.uci.edu/mingquan/www/ILAMB/Download/CODES/CODES/subroutines/convert/read-NBCD2000.pro http://redwood.ess.uci.edu/mingquan/www/ILAMB/Download/CODES/CODES/subroutines/convert/convert-NBCD2000.ncl http://redwood.ess.uci.edu/mingquan/www/ILAMB/Download/CODES/CODES/subroutines/convert/write-NBCD2000.ncl